Cables user
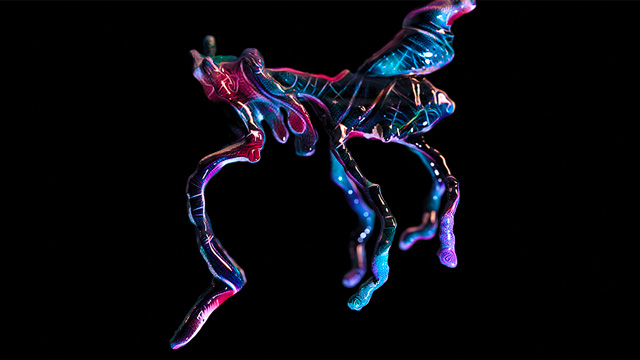
Wirmachenbunt created an amazing website where lots of different elements came together to make something really beautiful, it also shows what cables is capable of when used for commercial projects.
You can see the results here
We asked him some questions to give us insights into the creative process of how the web page was created.
A big thank you to him for taking the time to answer them.
If you'd like to use cables in a commercial
capacity but are missing some features or need custom support then don't hesitate to contact us to help you create a solution.
Could you tell us a little about yourself ? (background, previous work/s, current work/s)
Hi, I'm Chris Engler from Hamburg, running a studio called wirmachenbunt, hence the username. We create primarily interactive media installations, ranging from large scale video wall presentations to complex exhibits, combining real time graphics, physical input and architecture. So far vvvv has been the tool of choice, especially when it comes to boygrouping (multi-device rendering) and connecting to all sorts of electronics. Apart from the studio works, I teach at the Muthesius University of Fine Arts and Design.
Creating digital projects / artworks for over 10 years now, it is natural to explore new ways of publishing and emergent playgrounds. I actually registered at the cables website in 2017 but didn't dive into the tool too much. But it was kinda amazing what you could do in the browser at this point. There was some conversation with pandur in between the years and then right before corona hit germany, we managed to organize a workshop at the university. This was the kickoff for me to actually understand cables and have a go with it.
How did this project start out? What were the end goals
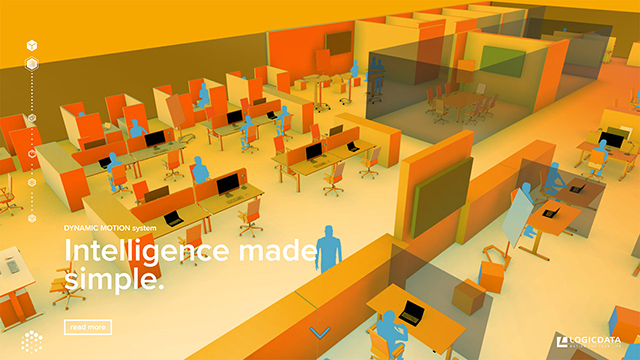
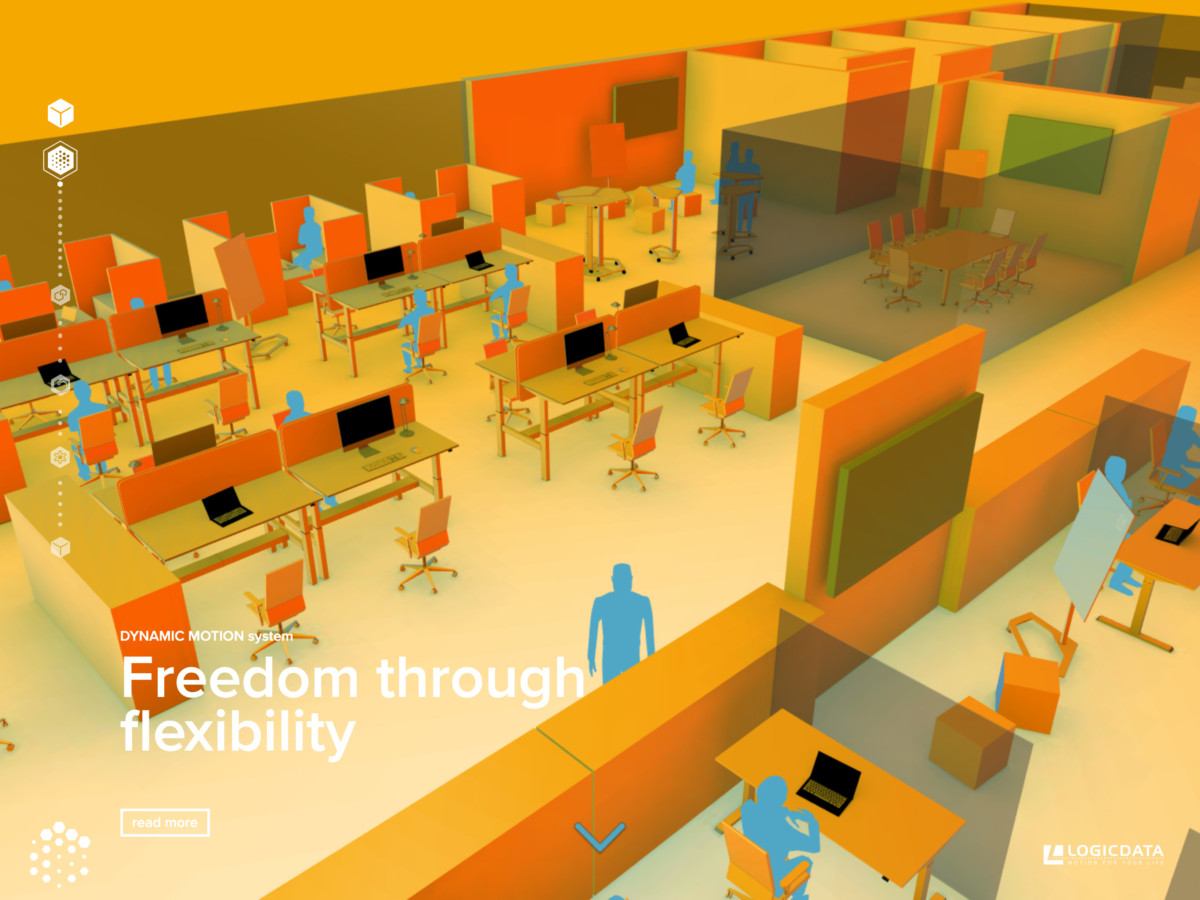
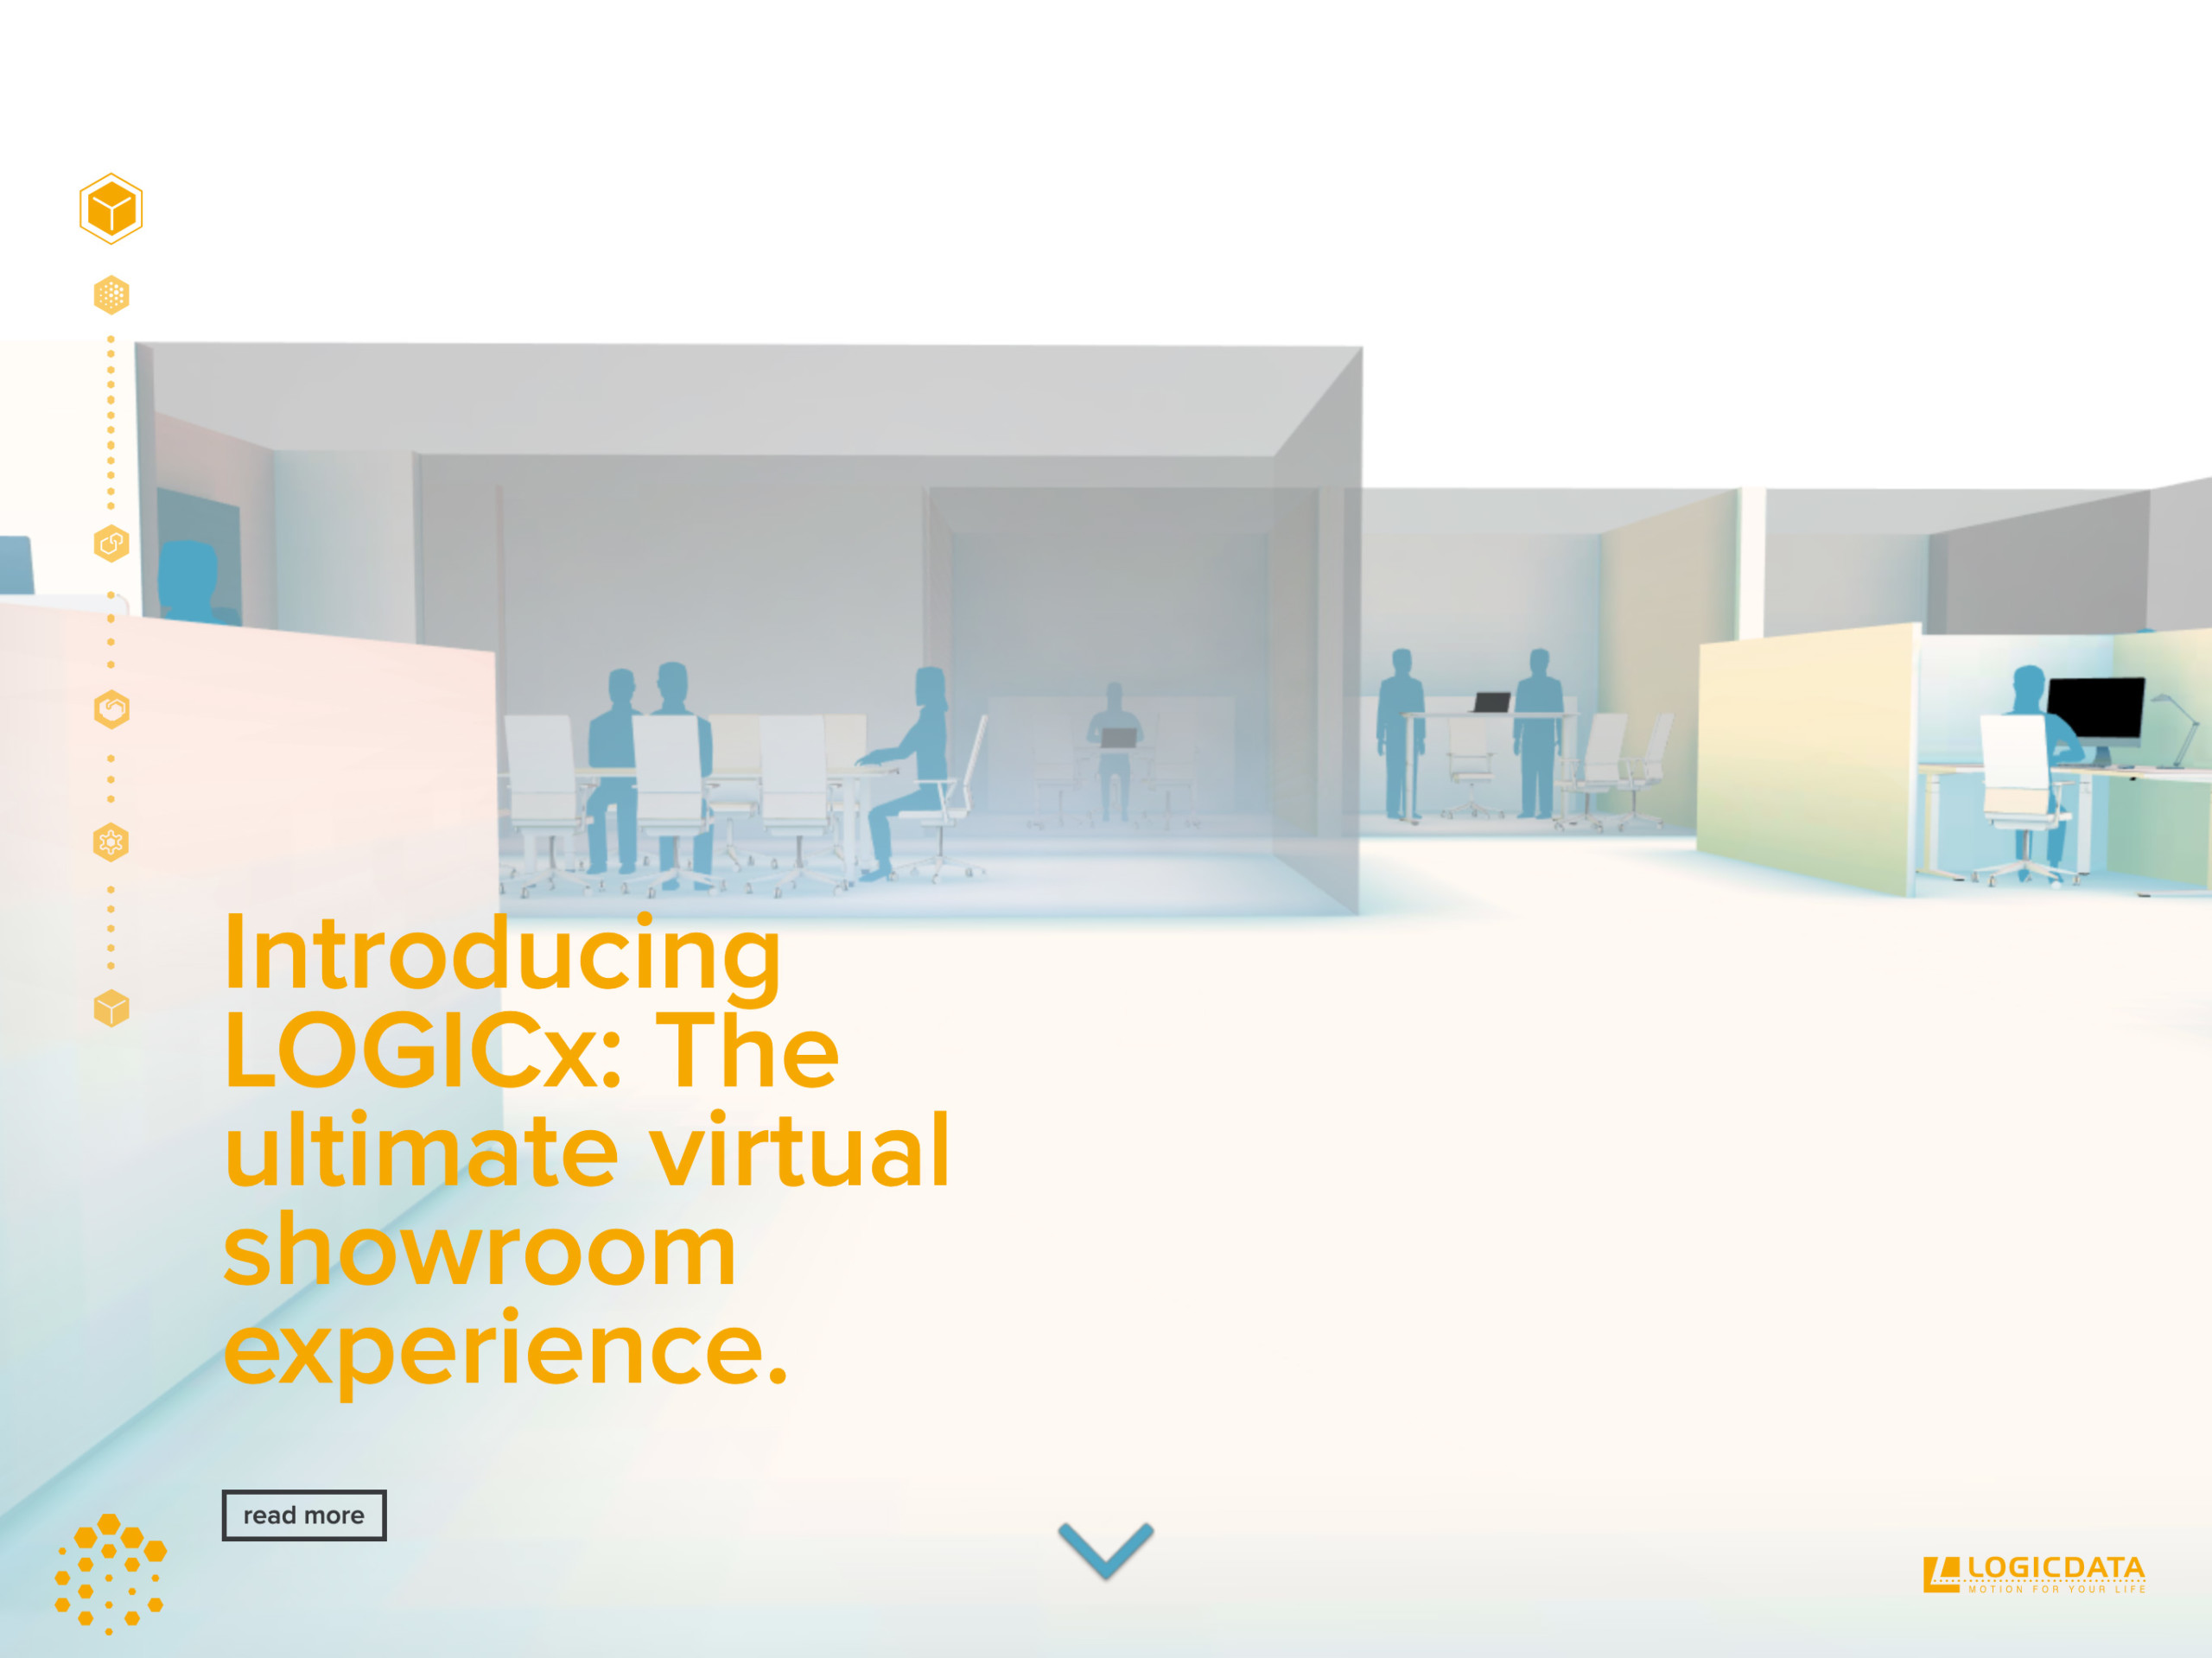
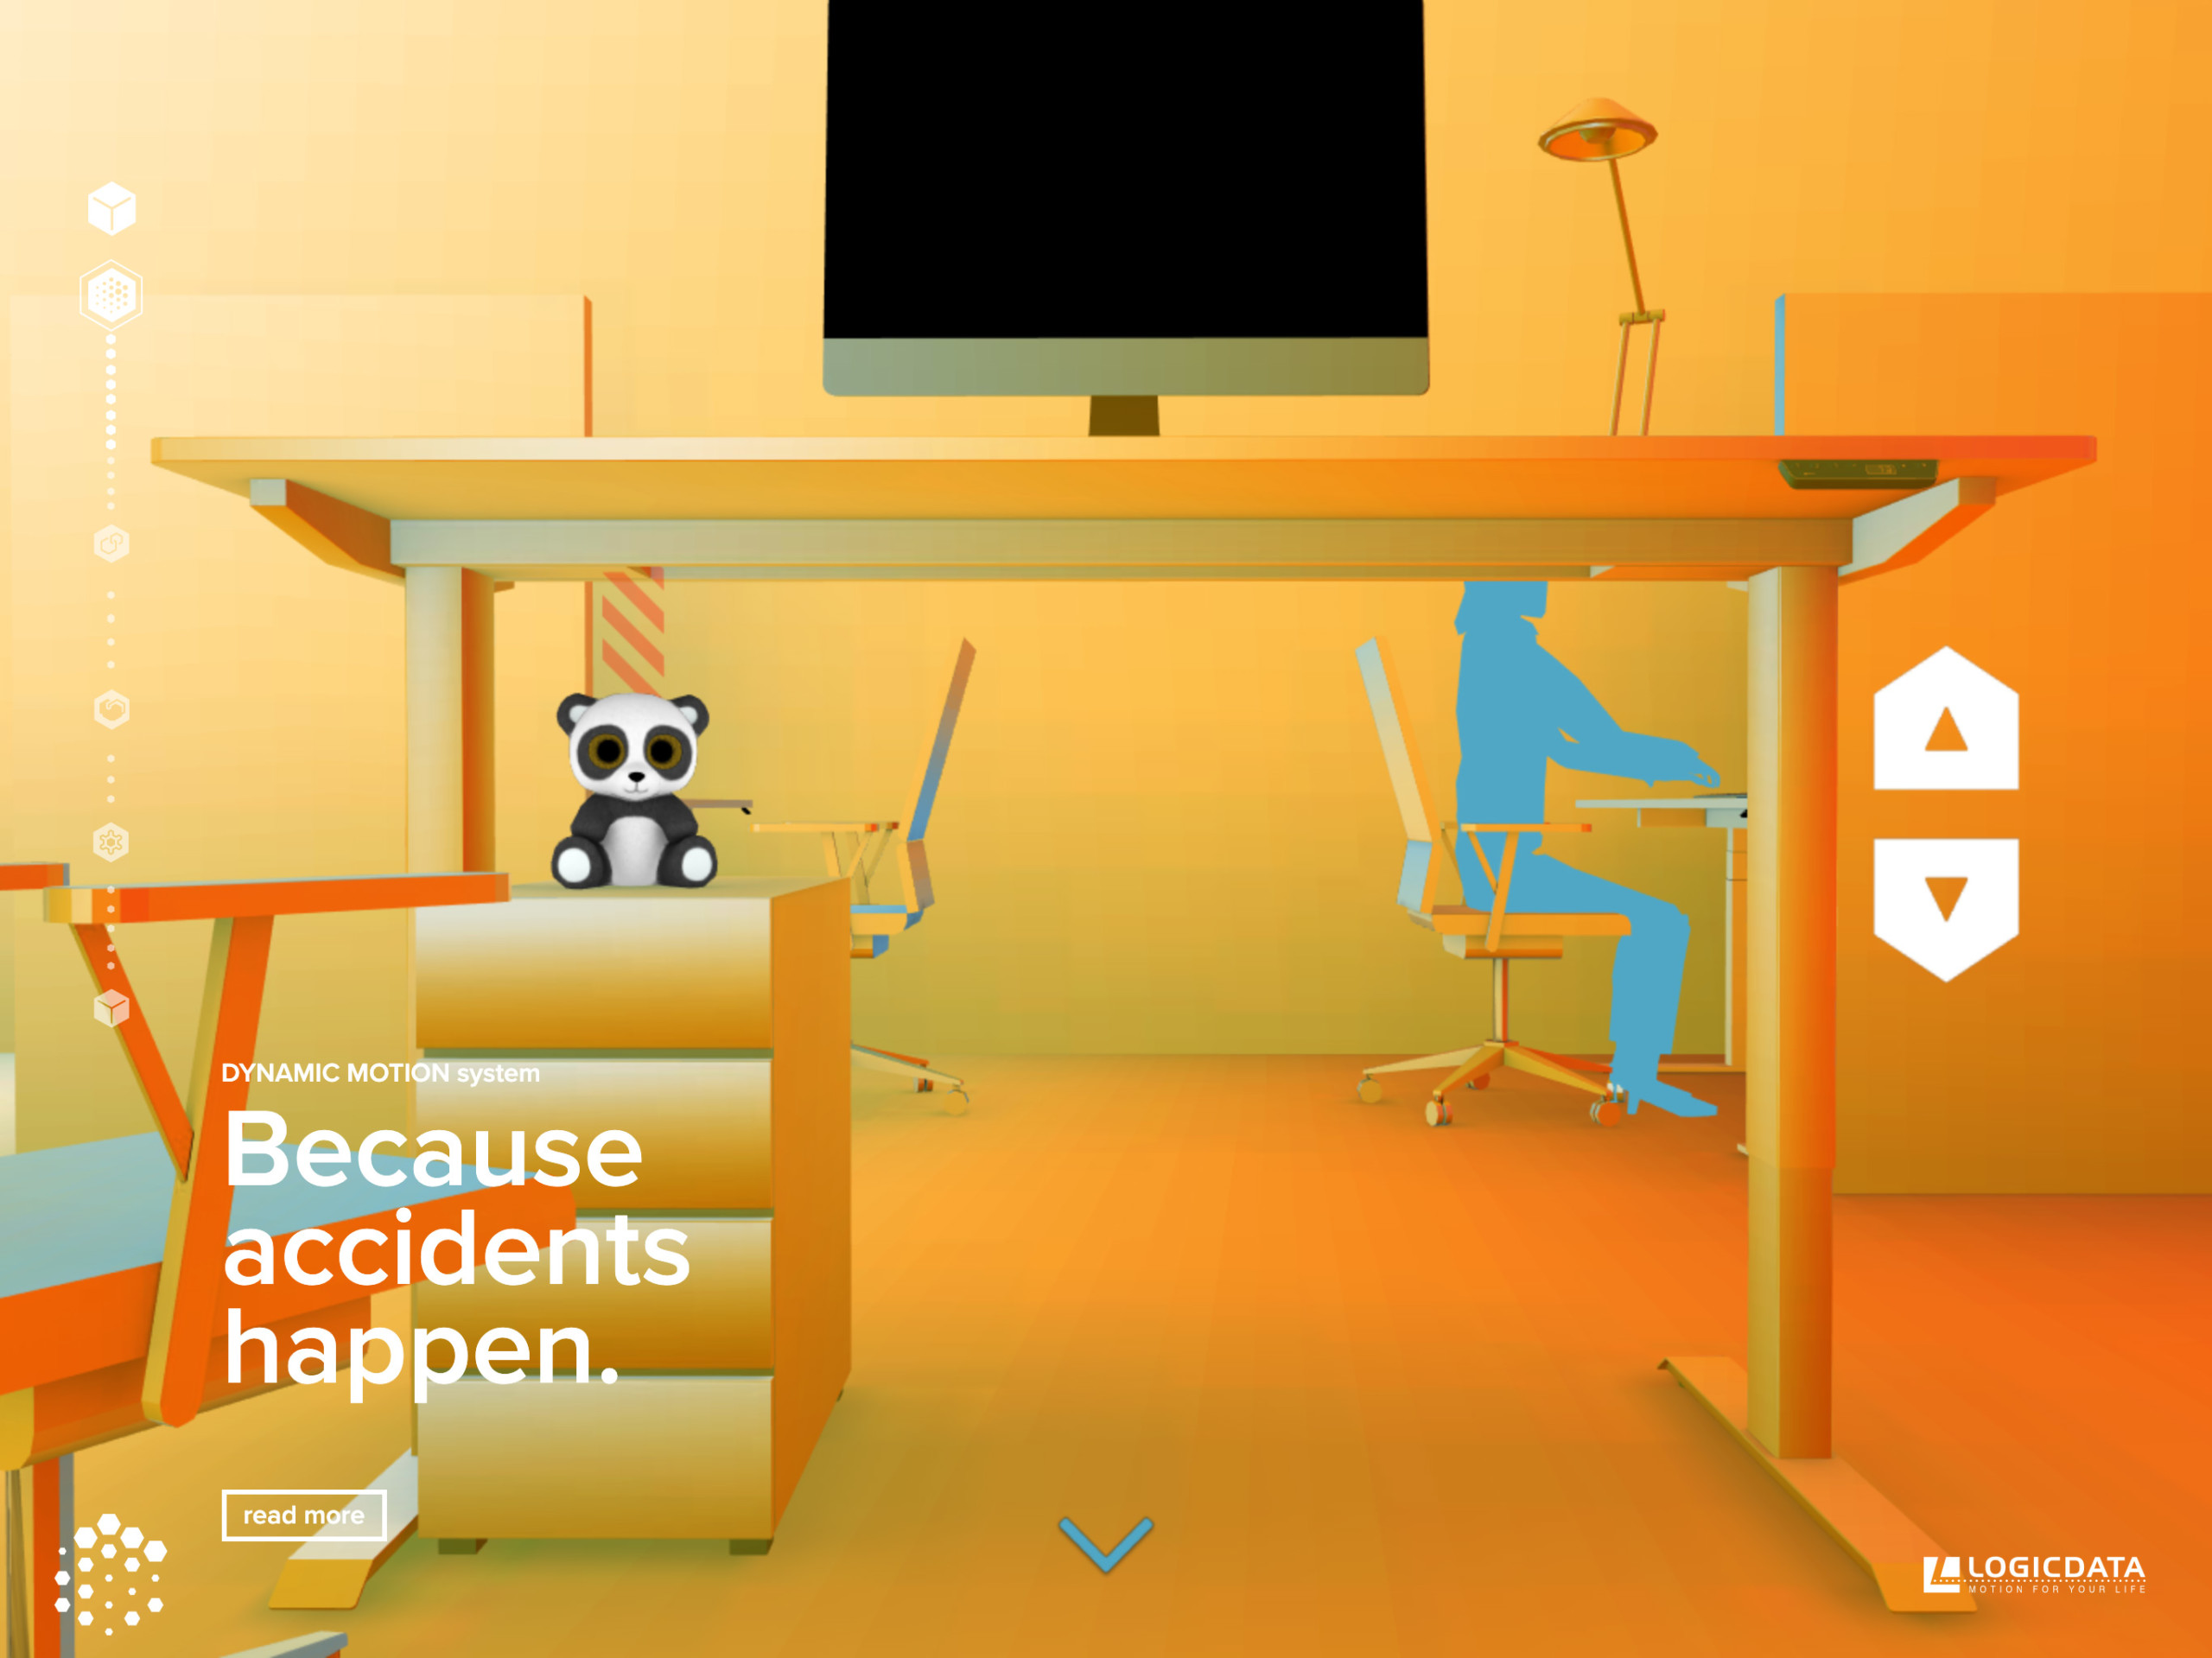
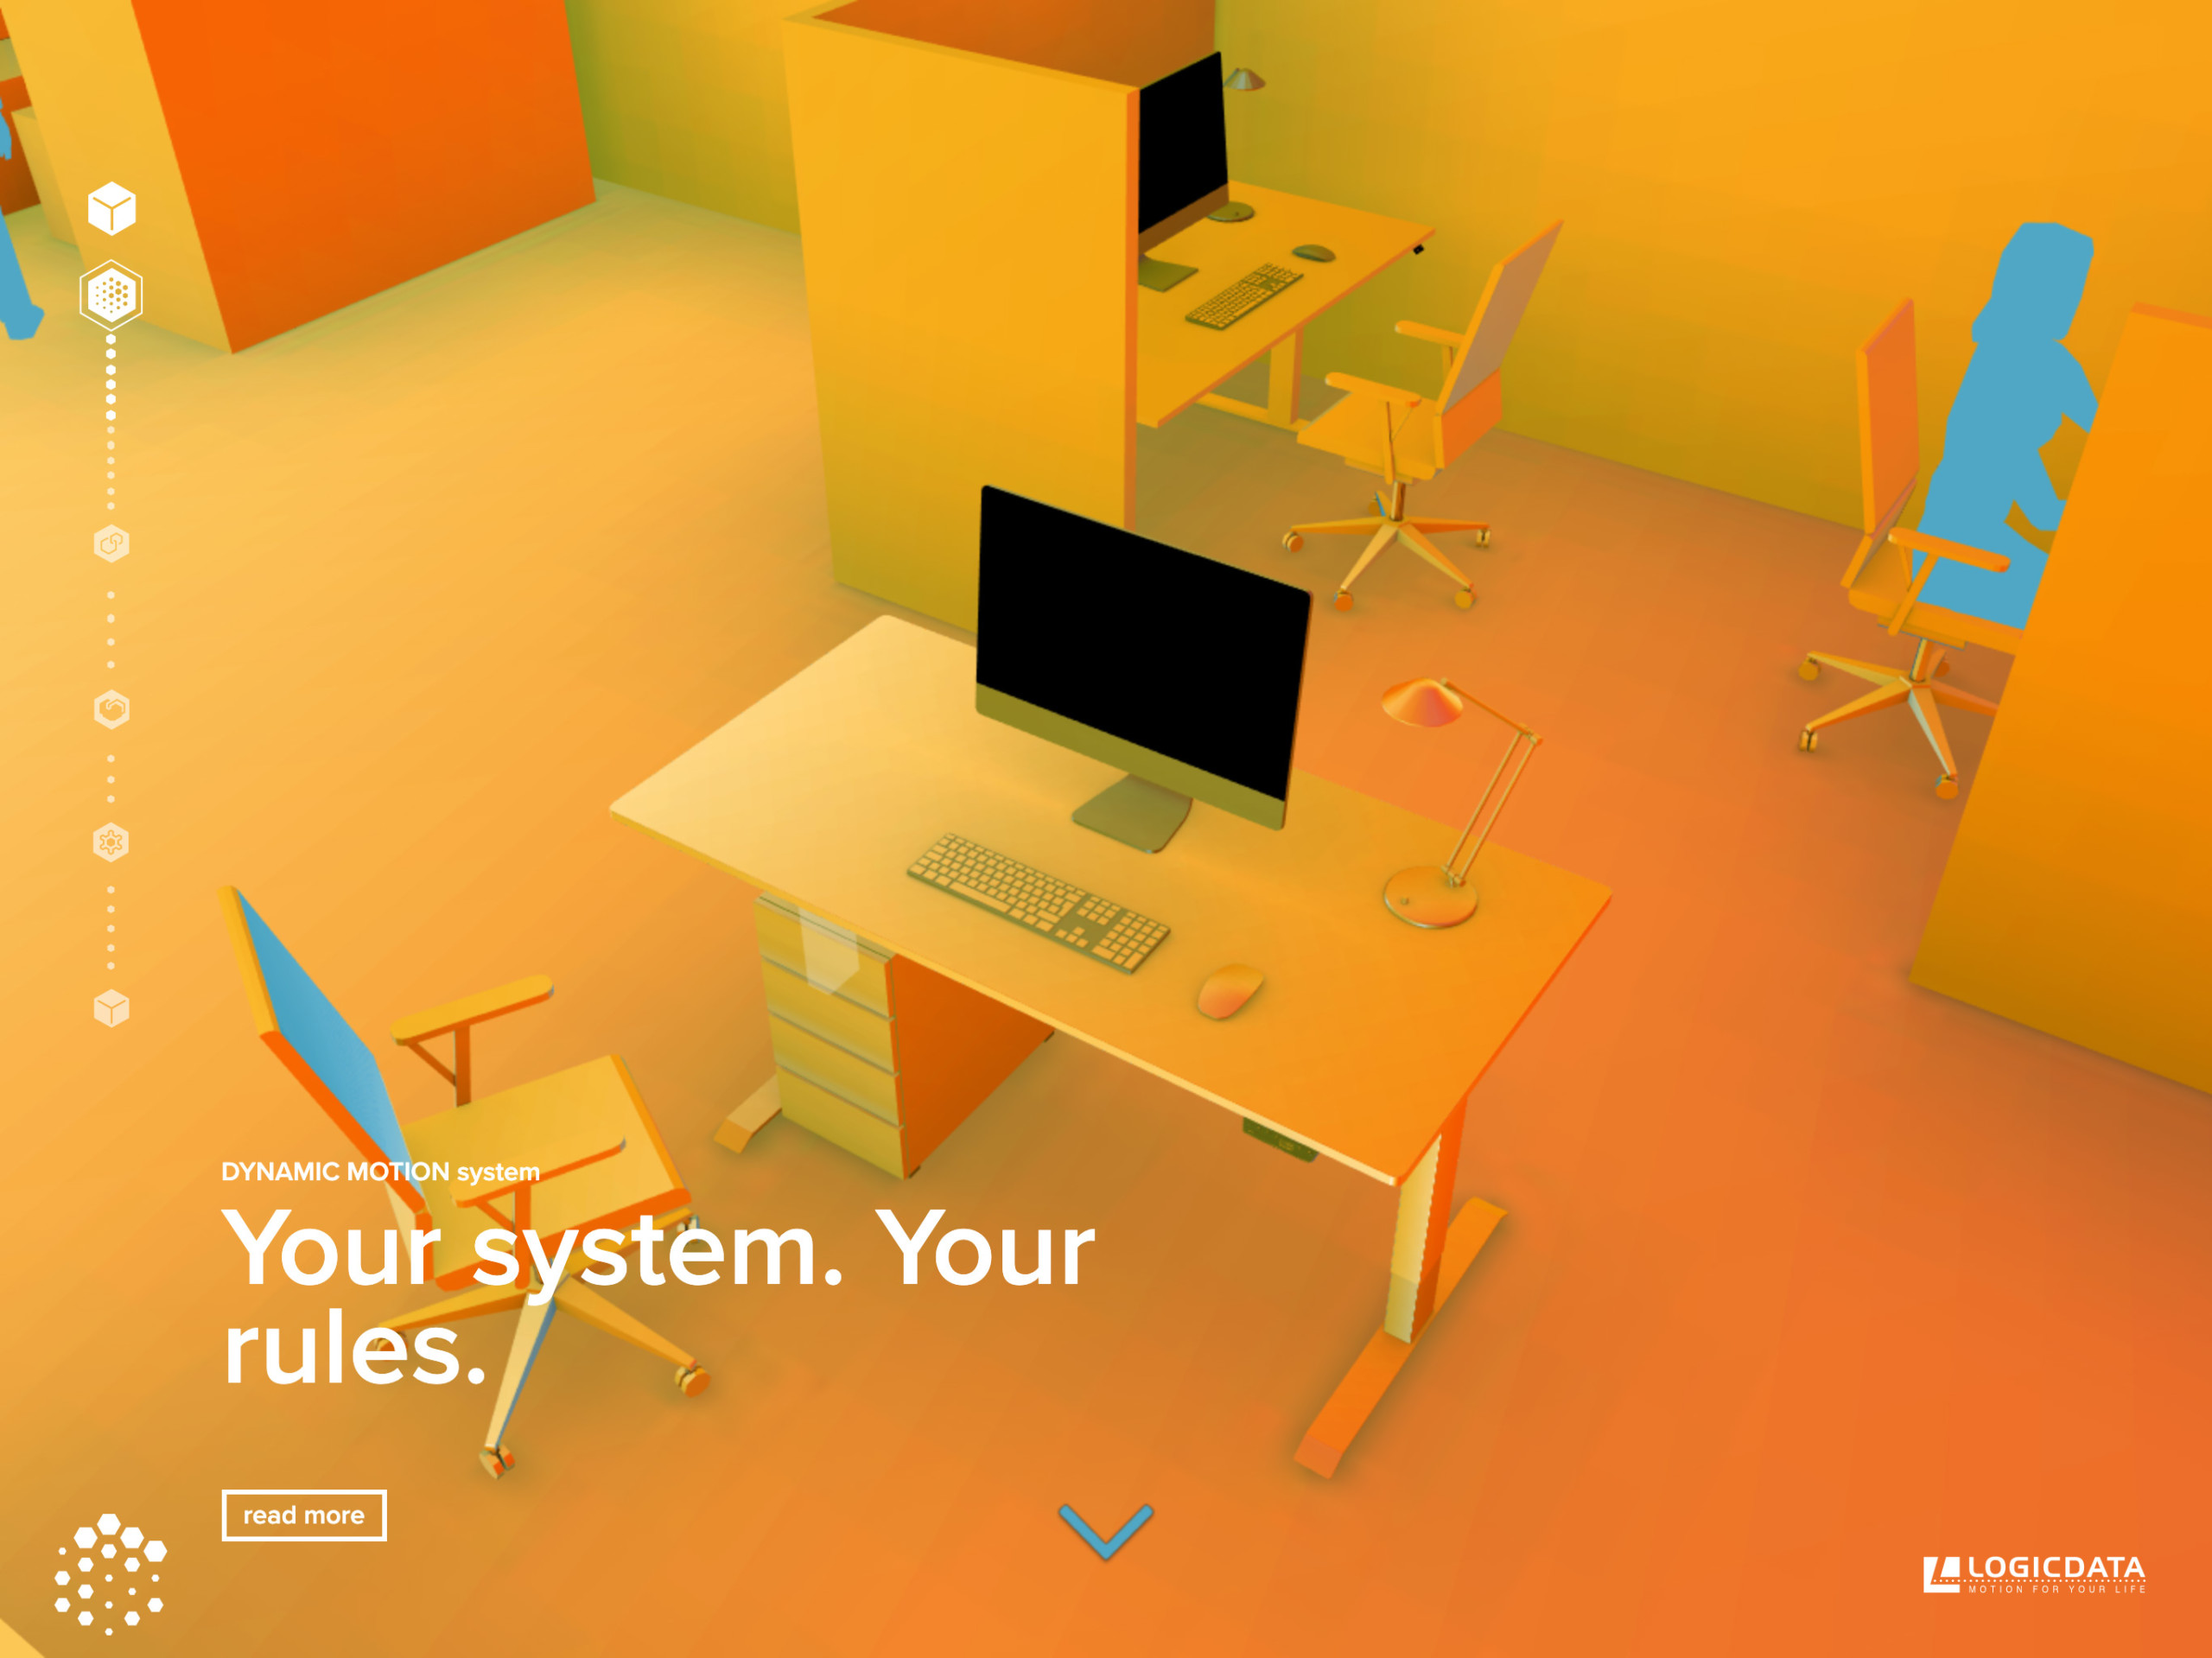
Well, thanks to corona, my friend Patrick at LOGICDATA came along with the idea to bring the canceled trade show content to the web. A few pingpong discussions later, the draft was a vertical scroller, controlling a camera animation, seamlessly through a virtual office space, highlighting the products of LOGICDATA. This includes some secondary interaction, like moving the table up and down.
We had like 6 weeks from draft to release, using cables for the first time. The end result is pretty much what we wanted. There will be an update in the future, since we learned a lot, content-wise and how the interaction is perceived. One thing we didn't finish in time is multiple virtual humans, animating through the scene.
Why did you decide to use cables to create this webpage?
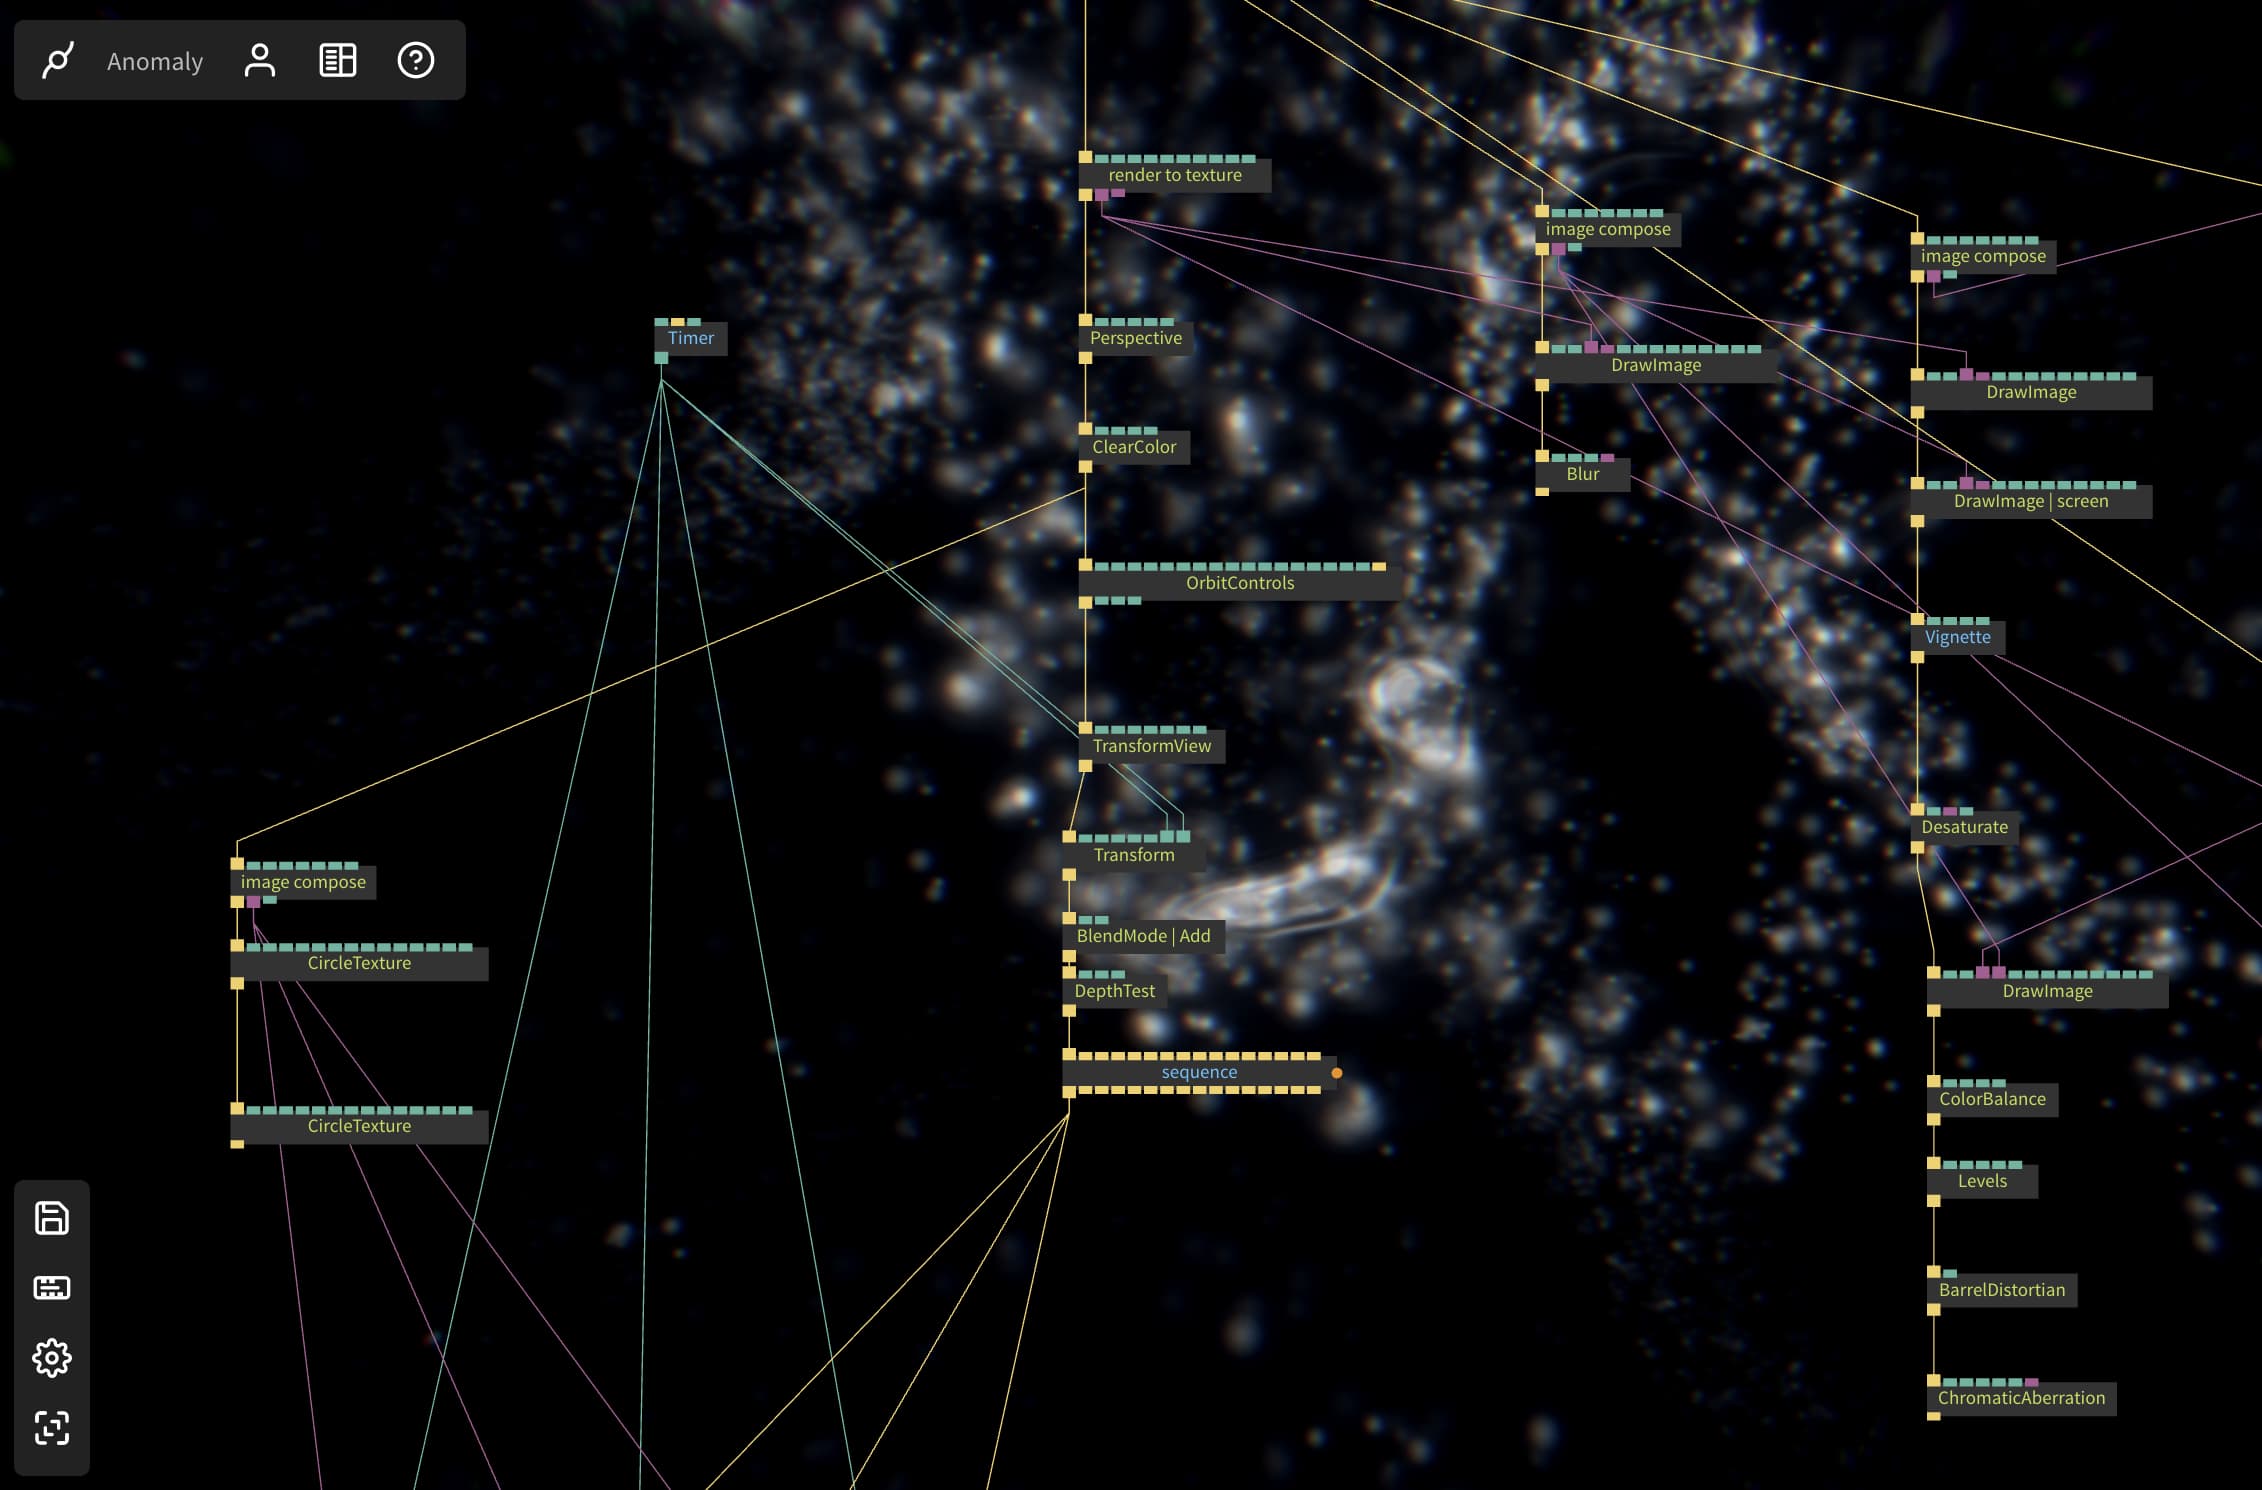
Short answer, we needed WebGL and a node-based environment felt familiar.
Can you tell us what other programs and processes that you used to prepare the content?
There are the obvious ones like Photoshop and Illustrator. Blender proved to be the best match for cables concerning 3D stuff. The GLTF export just works. We used to use Cinema4D alot before but we’re transitioning to blender now. Primarily due to the export trouble with Cinema4D. There was actually a bit of vvvv involved, I made a patch to bake the alpha channel of a PNG sequence to JPEGs.
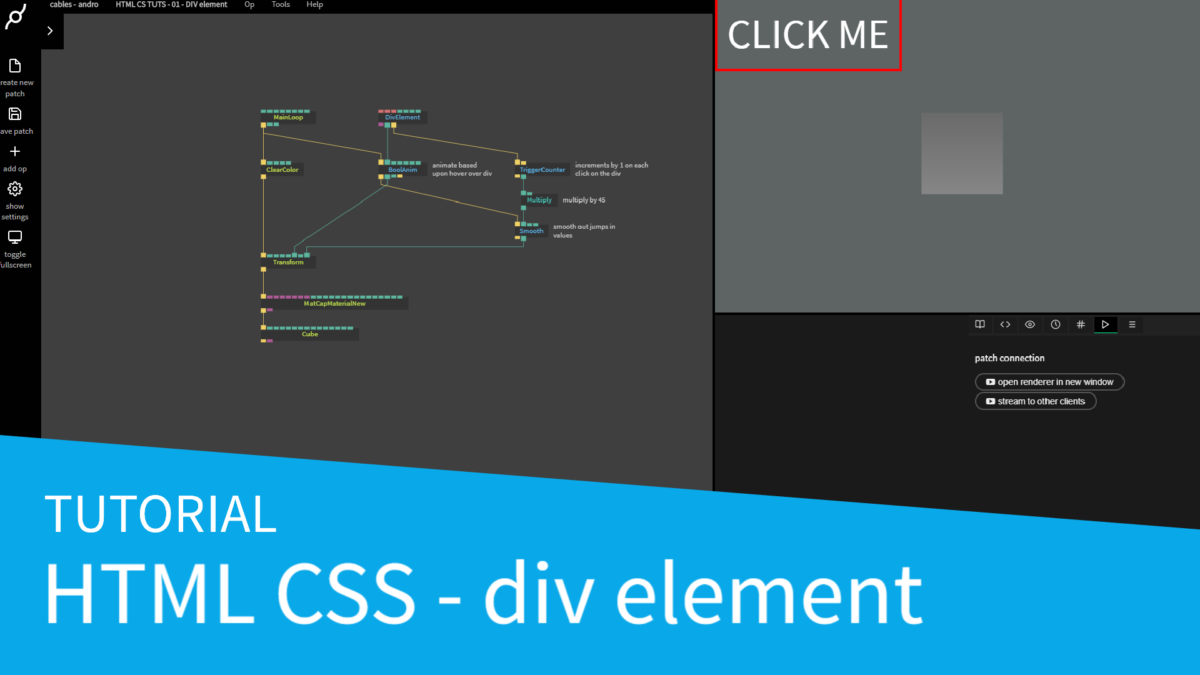
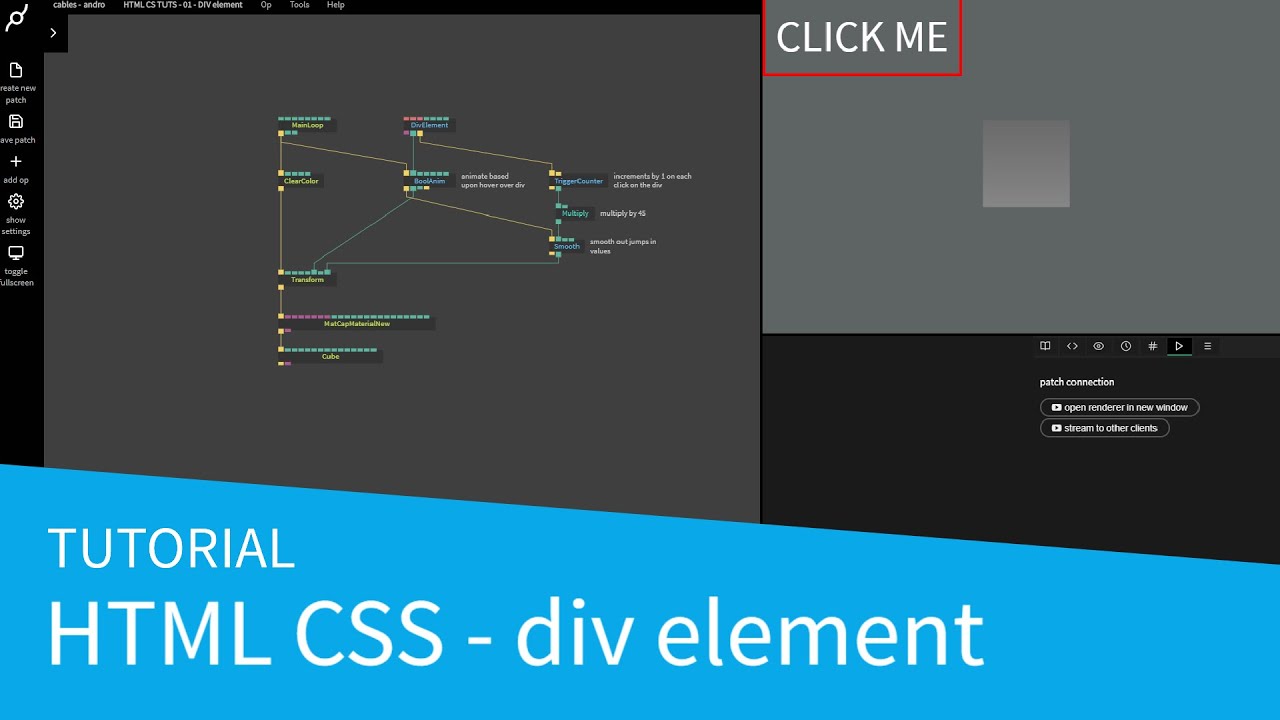
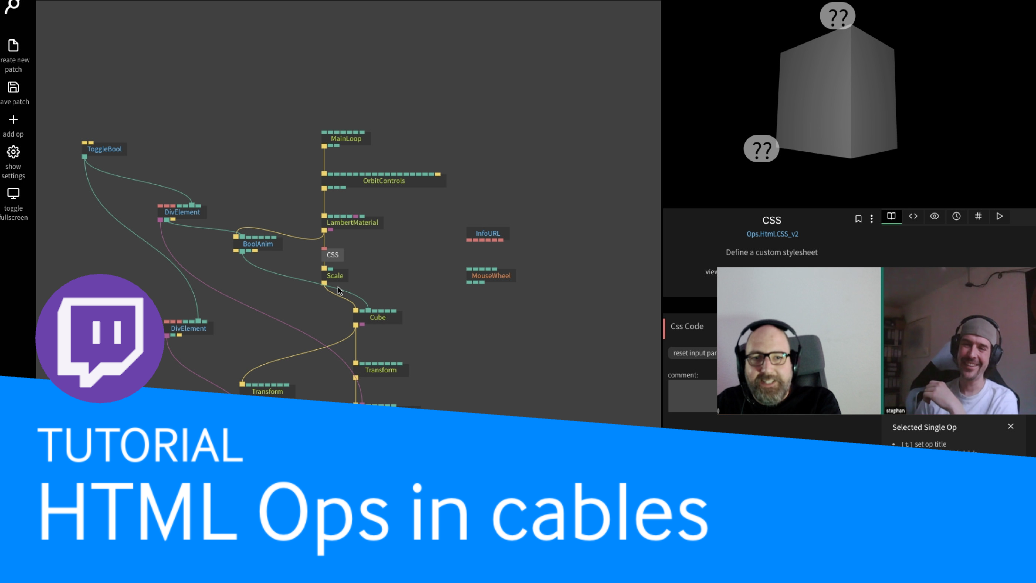
Is the HTML and CSS a part of the cables patch or is it a separate layer?
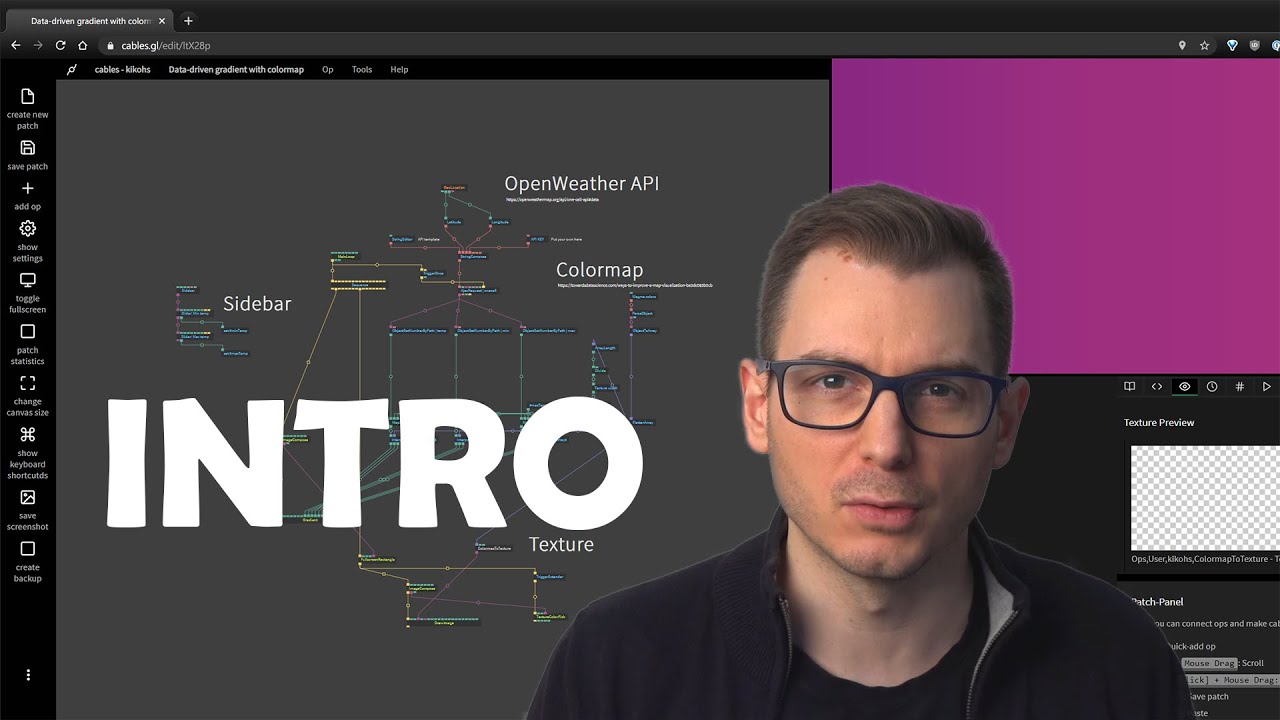
The HTML and CSS is generated directly by cables. Joscha (responsible for the HTML stuff) had to make a lot of new op's to manage the HTML layer with arrays. It's awesome you can create HTML elements with cables, but next time we will go a different way. Primarily to work in a collaborative way on a project. One can handle the HTML layer outside of cables, while the cables developer can progress independently. We might reconsider this workflow if teams can work in parallel within a cables project.
How did you make one large seamless scrolling experience?
Everything depends on one value, controlling a GLTF camera animation and translating the HTML content. Big thanks goes to pandur for the emergency help during the project, especially the camera data ops and missing quaternion2euler fun.
I cared a lot about file size and performance, since the goal was 60fps on a broad range of devices. Hence bits and pieces are only active (ifthen FTW) when in range. Multiple 3D objects are instanced to save draw calls, which works quite well with the GLTF data you get. And the engine image sequence uses JPEGS and a shader to achieve small size but with transparency.
What were the hardest challenges you encountered during the development process?
Not so much cables itself, I'd say multiplatform and browsers. For an offline developer like me, it was kinda scary to go down this rabbit hole. There have been a couple of moments, where things just didn't work on some devices and we had to find out, painfully where things could go wrong. Like iOS loves power of two textures and everything else doesn't care. Or the performance was rubbish on a high end android device which was caused by some constantly evaluating op.
Anything else you'd like to share?
First, I fell in love with cables. It is playful to just open the browser and get going. I can show the stuff everywhere and everyone can have a go with it. And cables has the best of both worlds, patching and the ability to easily extend its functionality by code. And i'm not a javascript pro 🙂 .
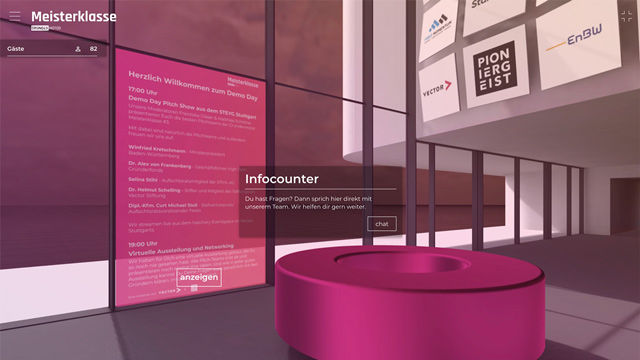
I see great potential in cables, not just as a demo tool or as an online environment. Since the release of LOGICX, I've investigated the cables export to various platforms as native apps or electron. There will be wirmachenbunt tradeshow productions made with cables.